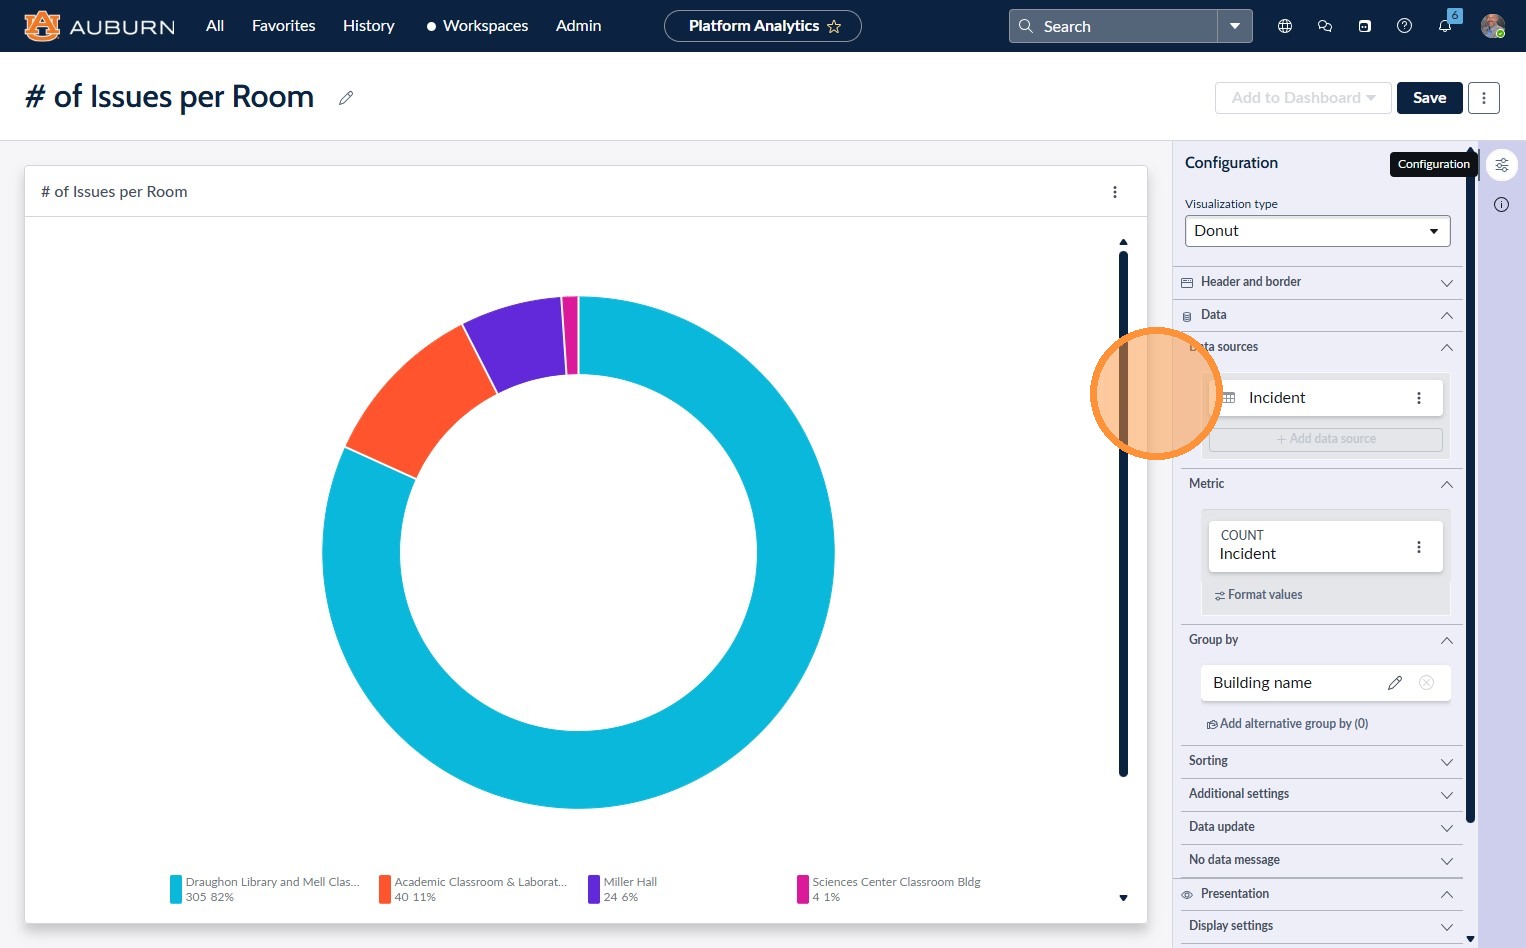
This guide shows where to find and open ServiceNow data visualizations so you can quickly view or manage reports. It’s useful for anyone who needs direct, step-by-step navigation to access Platform Analytics reports without searching through menus.
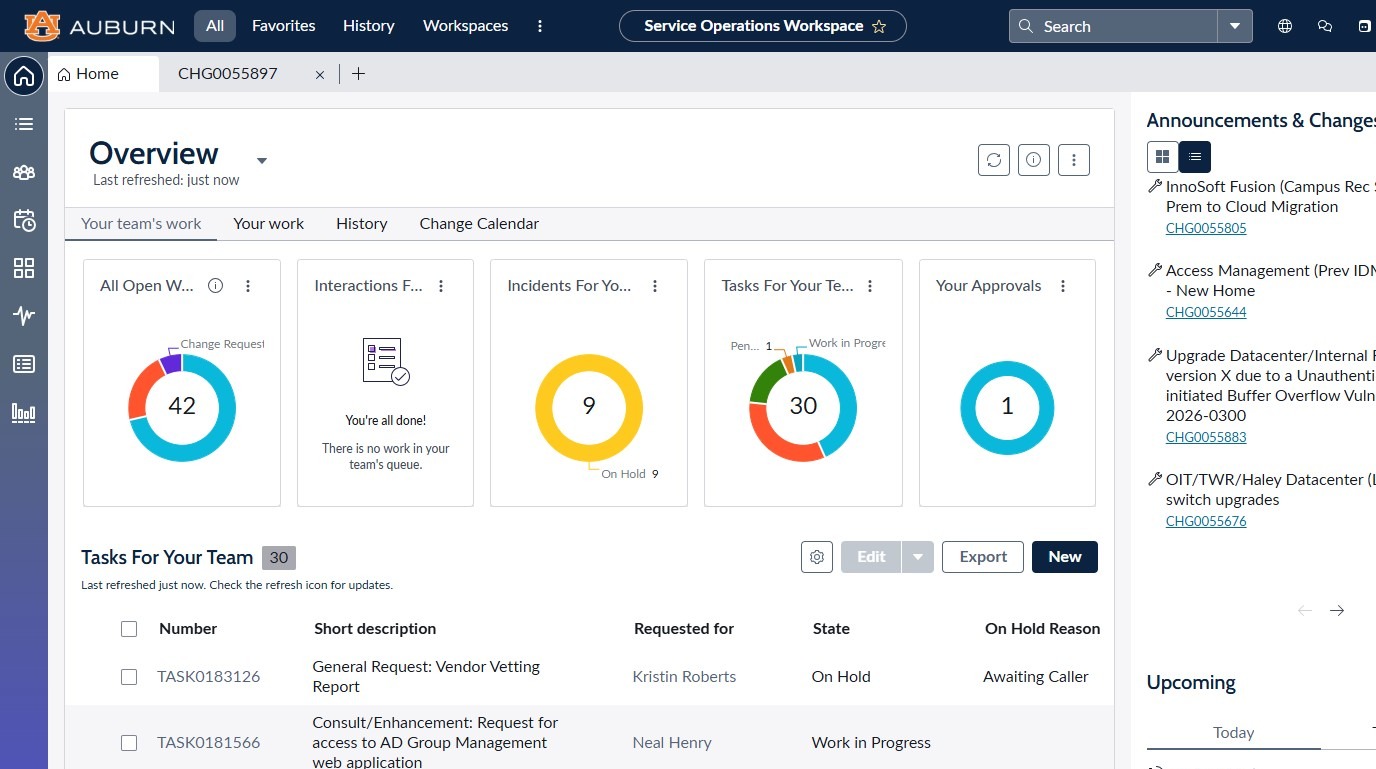
1. Navigate to https://auburn.service-now.com/now/sow/home
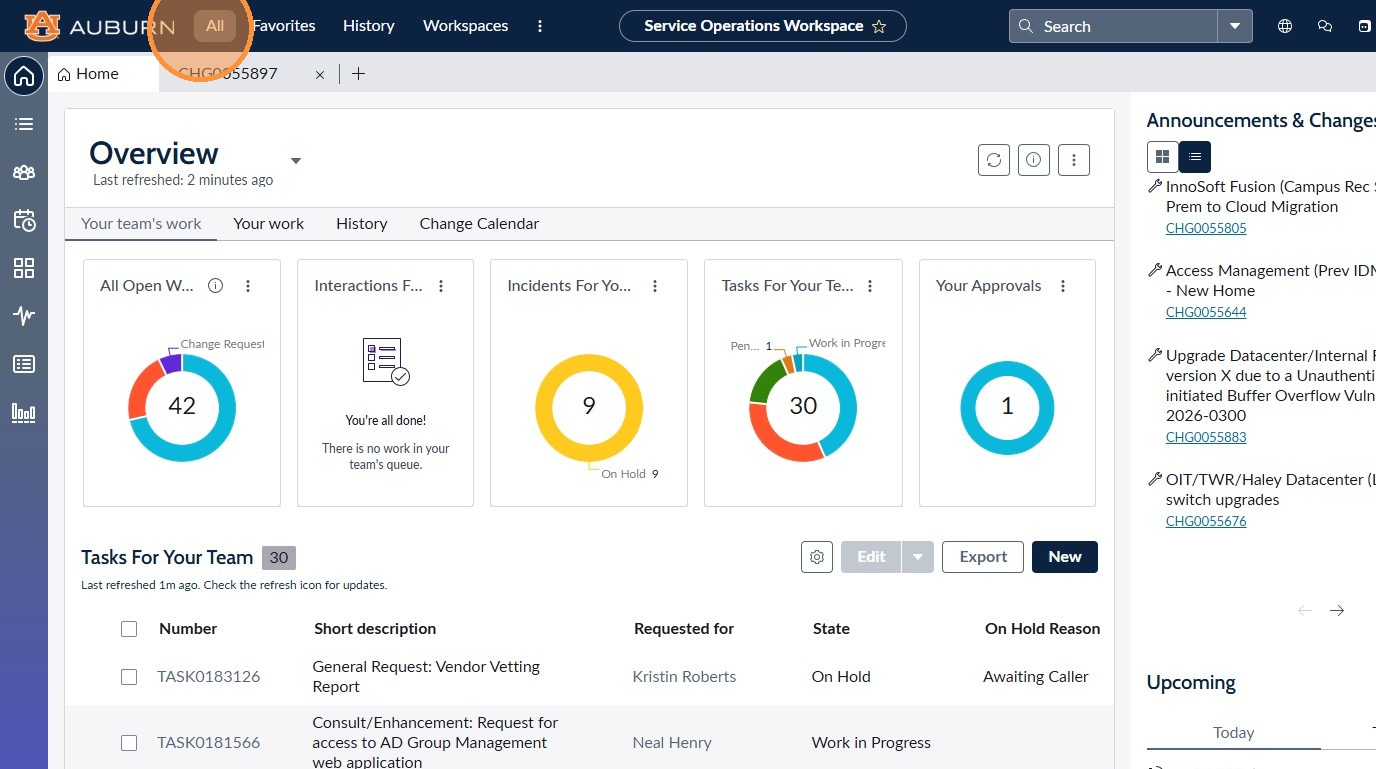
2. Click "All"
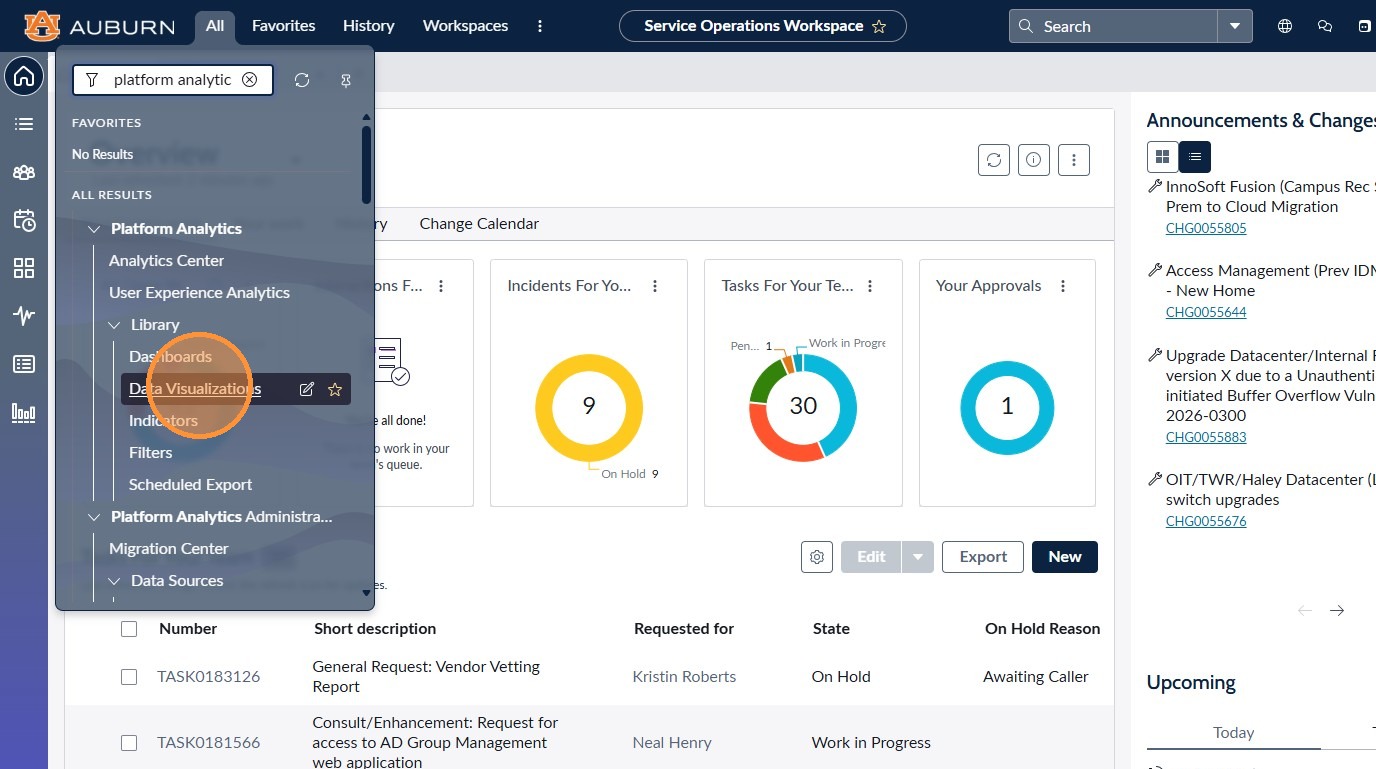
3. Type Platform Analytics into the Filter Navigator and click Data Visualizations
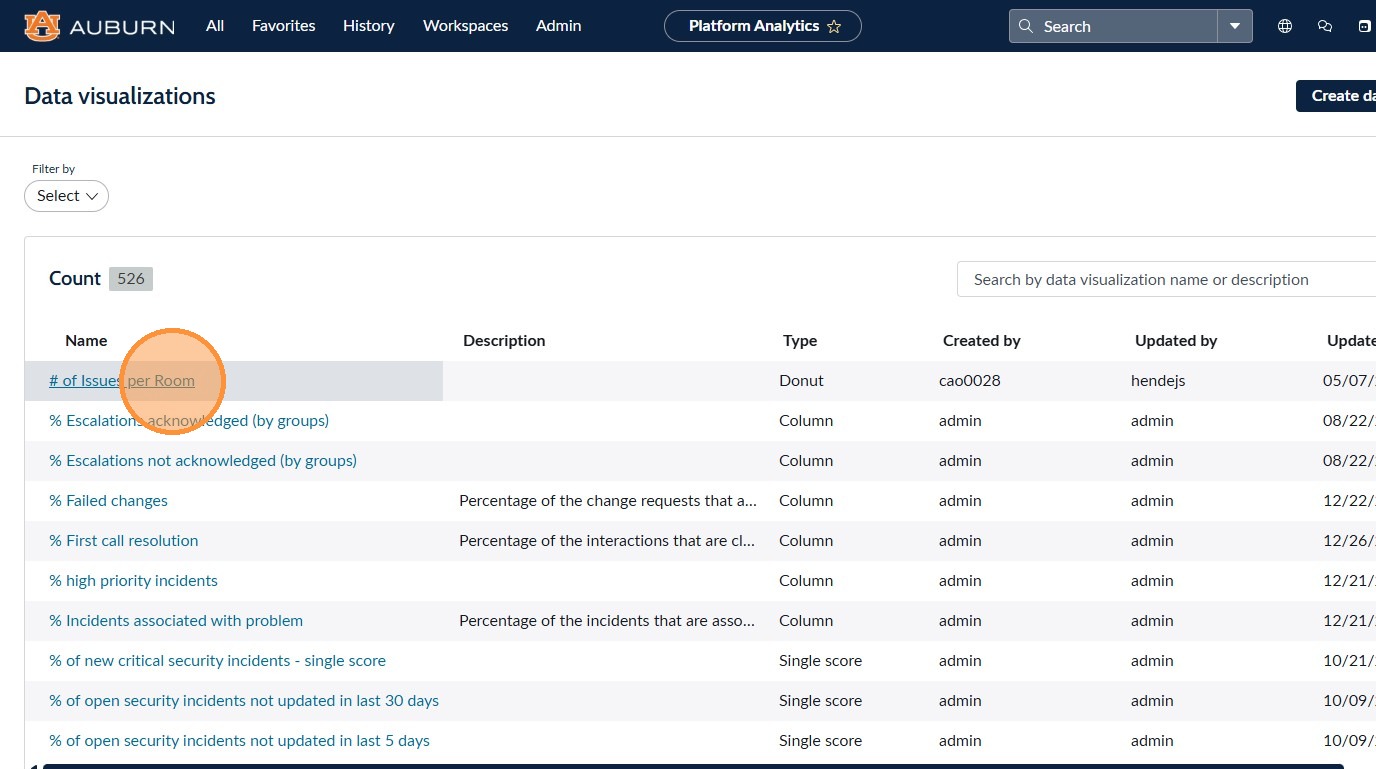
4. Click the title of the data visualization (report) you would like to open.
5. View, or Manage, your report